True Security Gear is reader-supported. When you buy through links on our site, we may earn an affiliate commission. This doesn't affect our verdicts.
Most burglars come through a door, and a large share of them do not need to break anything: federal victimization surveys show many entries through a door or window that was open or not locked. When force is used, the door is the most common target, then a window. As for timing, the Bureau of Justice Statistics found that burglaries of empty homes lean toward daytime, while burglaries of occupied homes lean toward the night. Every number below keeps the year and the source it came from.
Forced, unforced and attempted
The BJS report Household Burglary, 1994-2011, based on the National Crime Victimization Survey, separates burglaries by how the offender got in. Completed forcible entry means force was used, such as breaking a window or slashing a screen. Completed unlawful entry means no force, but entry by someone with no legal right to be there, for example through a door that was not locked or an open window. The third category is attempted forcible entry.
| 2011, by type of entry | Victimizations | Per 1,000 households |
|---|---|---|
| Attempted forcible entry | 549,200 | 4.5 |
| Completed forcible entry | 1,226,700 | 10.0 |
| Completed unlawful entry (no force) | 1,618,800 | 13.2 |
| All household burglary | 3,394,700 | 27.6 |
Unforced entry was the largest single category in 2011. The same report says the burglary rate fell 56% between 1994 and 2011, from 63.4 to 27.6 per 1,000 households, using two-year rolling averages. The FBI counts differently, using crimes reported to police, but its 2019 Uniform Crime Reporting data point the same way: of an estimated 1,117,696 burglaries that year, 55.7% involved forcible entry, 37.8% were unlawful entries and 6.5% were attempted forcible entry. Residential properties made up 62.8% of all burglaries in 2019.
The two sets of percentages are not comparable line by line. One is a household survey from 2011 and the other is police data from 2019, and they classify attempts differently. What they share is the point: a large block of burglaries involves no force at all.
The doors and windows that get used
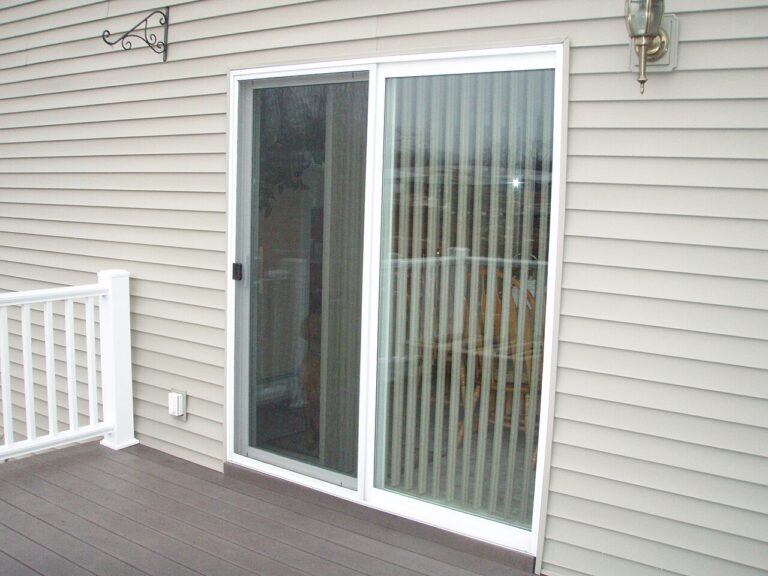
A second BJS report, Victimization During Household Burglary, covers 2003 to 2007 and averages about 3.7 million household burglaries a year. On forced entry, its text says damaging or removing a door was the most common type of entry in forcible and attempted forcible entry burglaries.
Its table of completed forcible entries, in homes where no one was present, gives the breakdown.
| Entry point, forcible entry, no one home (2003 to 2007) | Average per year | Share |
|---|---|---|
| Door | 696,290 | 73.4% |
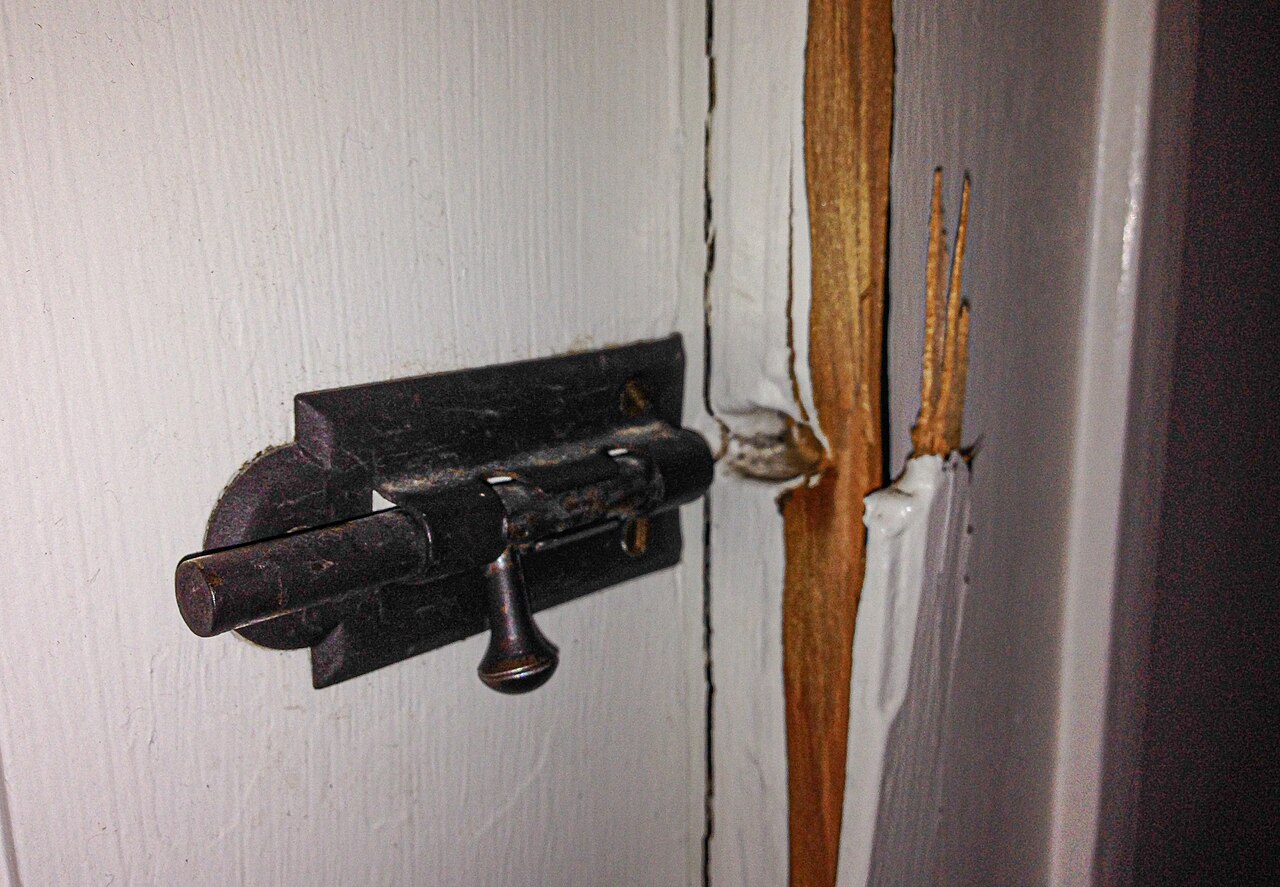
| Door damaged or removed | 43.5% | |
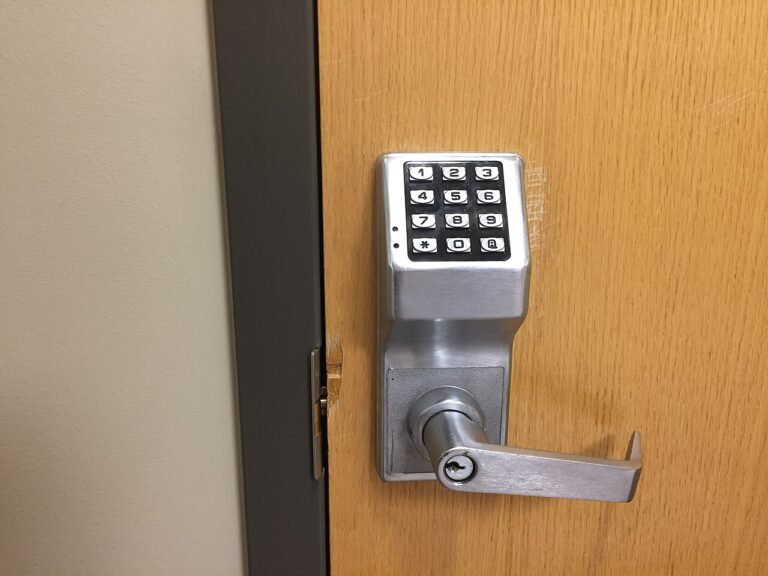
| Handle or lock removed or tampered with | 25.6% | |
| Window | 462,430 | 48.8% |
| Window pane damaged or removed | 30.0% | |
| Screen damaged or removed | 8.8% |
The shares add up to more than 100% because one burglary can involve more than one entry point. When a household member was home, the report gives 70.4% for a door and 47.0% for a window. The practical reading is that a door that resists a kick and a lock that resists tampering matter more than any single window fix, which is where how to reinforce a door starts. Windows still carry almost half the forced entries, and the notes on apartment window security cover the cheap ones.
Doors left open or not locked
The same report breaks down unlawful, or unforced, entries. In unoccupied residences, an open door or window accounted for 17% and a door or window that was not locked for 40%. In 5% the offender got through a locked door or window by unknown means, and in 8% used a key. Occupied homes looked different: the offender entered through an open door or window in 27% and a closed but not locked one in 28%, and in 18% someone inside let the offender in.
Put plainly, in these 2003 to 2007 survey data a large share of unforced entries went through something left open or not locked. The cheapest security measure in the report is a habit. A deadbolt does nothing for a door nobody turned.
When it happens
Time of day depends on whether anyone is home. In the same 2003 to 2007 data, burglaries with no one home were more likely during the daytime, between 6 a.m. and 6 p.m. (43%), than between 6 p.m. and 6 a.m. (26%). Of burglaries with a household member present, about 61% happened at night and 33% in the daytime.
The activity of the household when it happened is worth noticing. In 25.1% of the burglaries where no one was home, members were at work or on duty. In 38% of the burglaries with someone home, they were asleep. For attempted forcible entry, tampering with door handles or locks was more likely when no one was home (30%) than when the home was occupied (19%).
If someone is breaking in while you are home, get to a safe room and call 911. Do not confront the person. The BJS report is a description of past burglaries, not a guide to confrontation.
What the data does not say
The surveys are broad, and they cannot tell you what is true for your street. They do not break results down by lock type, by neighborhood or by the presence of a camera or alarm. They also measure different periods: 2011, 2003 to 2007 and 2019 each stand alone here. Read them as a pattern, not as a forecast.
Our take
The pattern is stable across the sources: doors first, windows second, and a large unforced share. The first job is a habit of locking everything, daytime included. After that, reinforce the front door and the lock around it.
Common questions about how burglars get in
What is the most common way burglars enter a home?
In the BJS data for 2003 to 2007, damaging or removing a door was the most common type of entry in forcible and attempted forcible burglaries. Door entries were 73.4% of forced entries when no one was home, and windows were 48.8%.
Do burglars always break in?
No. BJS counts completed unlawful entries, with no force, as the largest category in 2011. FBI data for 2019 put unlawful entries at 37.8% of burglaries.
What time of day do burglaries happen?
BJS data for 2003 to 2007 show that burglaries with no one home were more likely during the day, from 6 a.m. to 6 p.m. (43%) than at night (26%). Burglaries with someone home were more often at night, about 61%.
How many burglaries involve a door or window that was not locked?
In the 2003 to 2007 BJS data on unoccupied homes, 40% of unlawful entries came through a door or window that was not locked and 17% through an open one.
What should I do if someone is breaking in while I am home?
Move to a safe place and call 911. Do not confront the person.
Who checked this
True Security Gear does not run a test lab and does not take units apart. One half of the work is documents: manufacturer specs, certifications, and seller claims checked against the paperwork. The other half is the record owners leave behind, in verified-buyer reviews, owner forums, and warranty complaints. Where that evidence is thin we say it is thin, rather than filling the gap with an adjective. The criteria are on How we evaluate.
Google lets you pick which sites come up first in your own results.